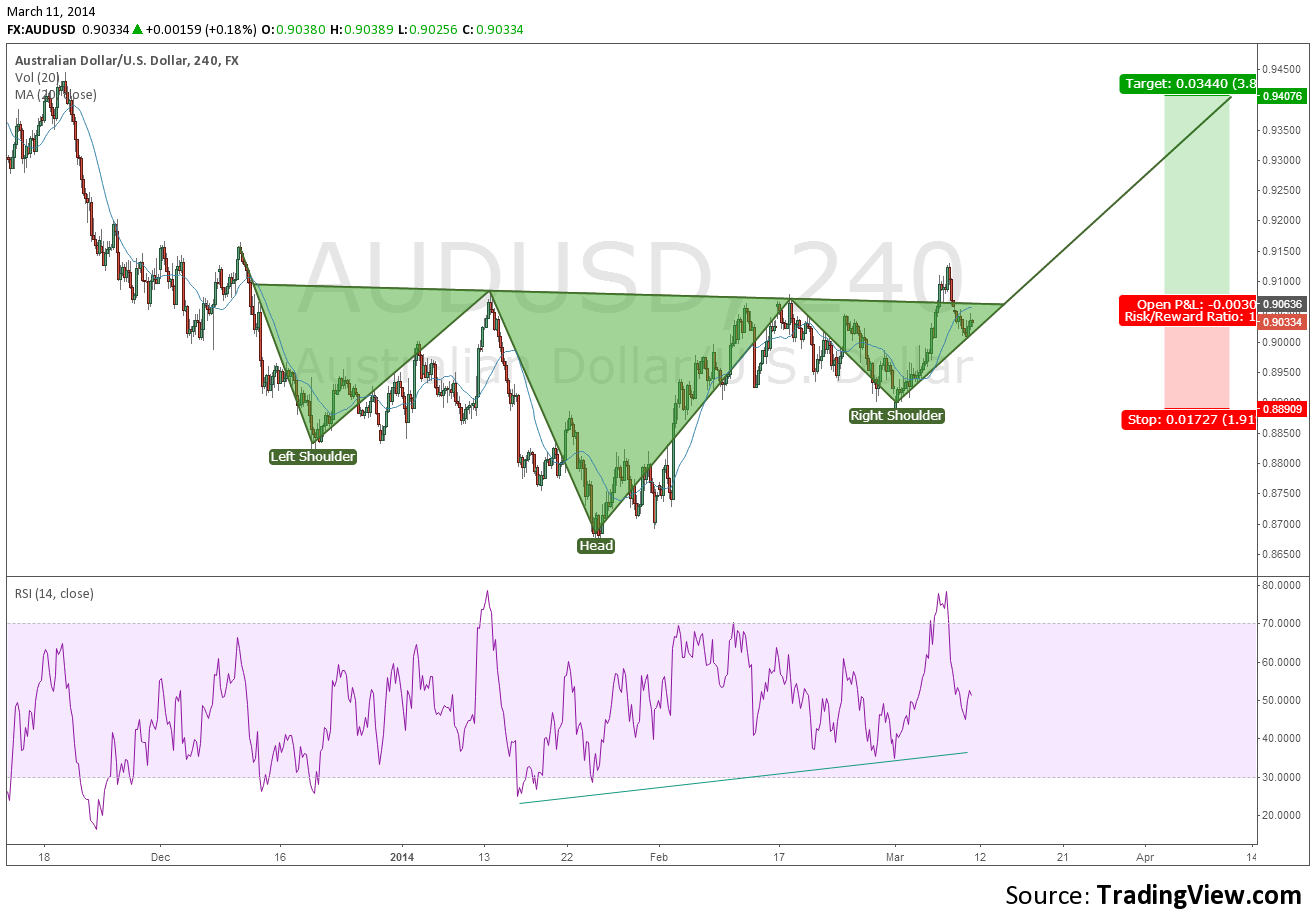
prediction system and chart The following Fibonacci Ratio Elliot wave analysis and forecast trading chart shows the aforementioned targets:

Analysis Chart with bottom, trend channel up, long signal entry and macd indicator in the direction of the forecast price movement
