prediction system and chart Currency: CADCHF
Strategies & Signals: short pozition @ 0.841
Target Level 0.8274
Target Period 30 days
Stop Level 0.85
Trading opportunities: bearish price movement forecast for the next 30 days towards 0.8274.
Resistance Levels 0.8425 Last resistance turning point of wave5.
Support Levels 0.8147 Last support turning point of wave4.Technical Analysis and Patterns:
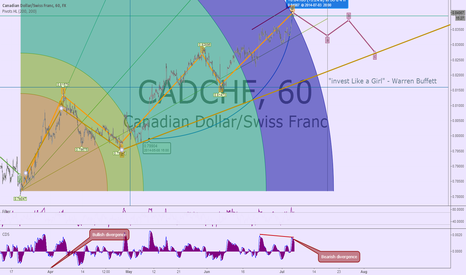
Wave 5 (Elliott Wave Theory) has broken through the resistance line at 03-july-20:00 GMT-2. Indicators: Bearish divergence, top up trendAlternative scenario: buy limit @ 0.8274. A break above the resistance could confirm the up move
The following Fibonacci Ratio Elliot wave analysis and forecast trading chart shows the aforementioned targets:

Analysis Chart with bottom, trend channel up, long signal entry and macd indicator in the direction of the forecast price movement


