Mar 11, 2014

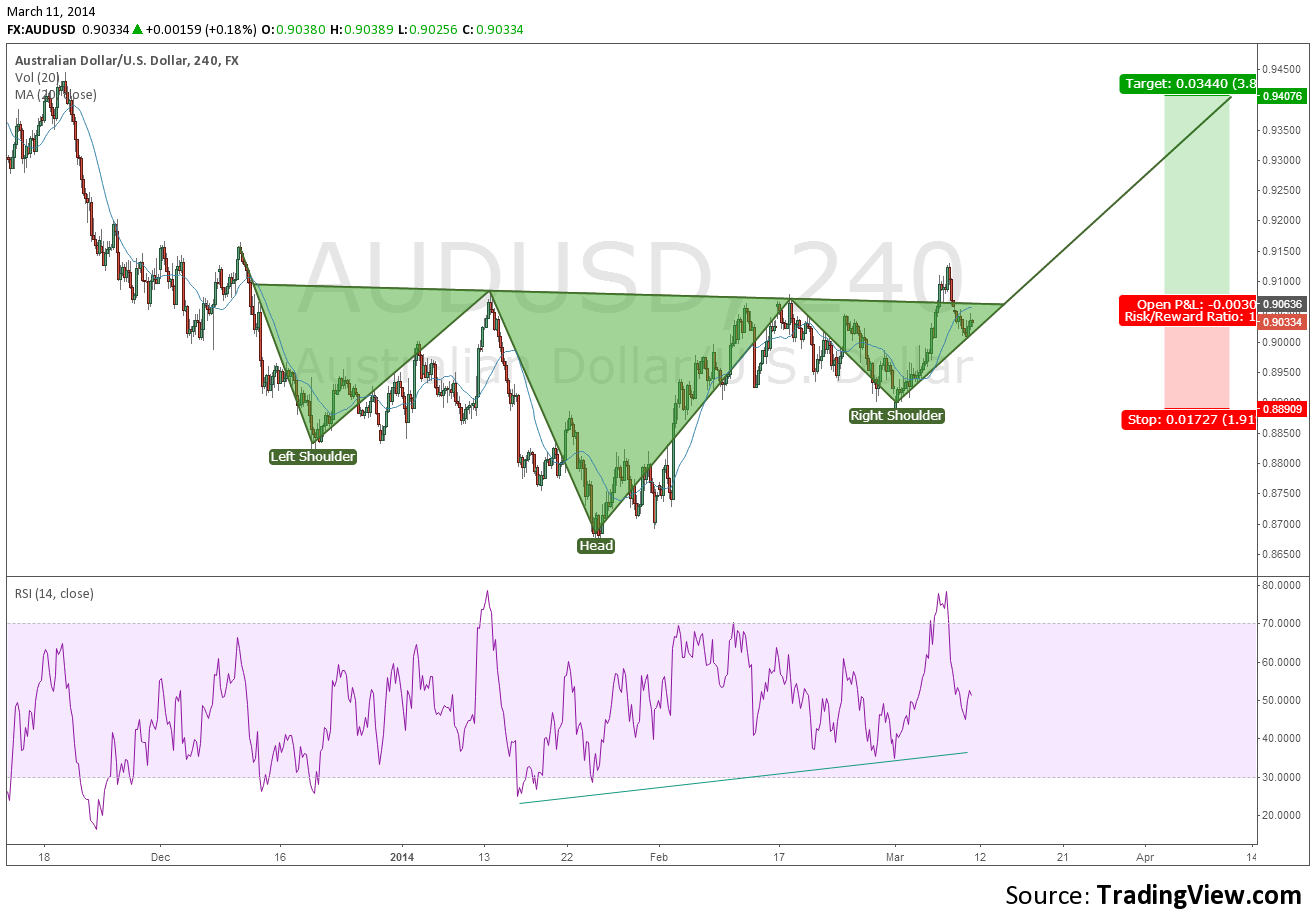
AUDUSD bullish forecast march 2014

AUDUSD Chart date range 01-Jan-12:00 GMT-5 forecast 10-Mar-00:00 GMT-5 Data interval 4 hour RSI 34 Candles MA
prediction system and chart The following Fibonacci Ratio Elliot wave analysis and forecast trading chart shows the aforementioned targets:
Chart AUDUSD, H4 TIMEFRAME, X-Trade Brokers, MetaTrader 4
Analysis Chart with bottom, trend channel up, long signal entry and macd indicator in the direction of the forecast price movement 

Mar 6, 2014

US Stocks forecast investing analysis march 2014 part1

$SPY $AAPL $AIG $AMZN $AXP $BA $BAC Elliot wave strategy analysis and forecast - bearish https://www.youtube.com/watch?v=yCmewOQFUOo